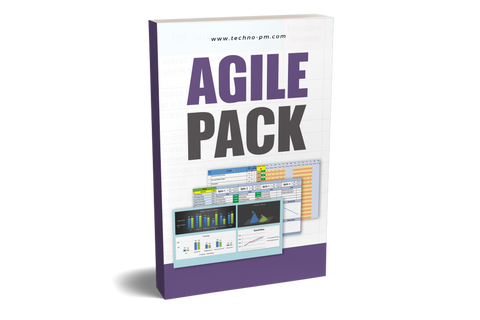
Agile Project Status Report Template - Excel
Agile Project Management Templates
Agile management is a method of managing projects that aim to provide new products or services. The management style is highly flexible and focuses on short iterations (called “sprints”) that have one feature as a goal and usually take 2-4 weeks.

Agile Project Status Report Template
Some Basic Agile Concepts
- A project is made up of any number of sprints, depending on the required features. This method is usually used on innovative short-term projects where TTM (Time to Market) is crucial.
- Each feature entails many iterations, and the customers’ feedback is needed after each one. This process is called a “sprint.”
Difference Between Waterfall and Agile
This method differs from the traditional waterfall approach in the following key areas –- Focuses on delivering working products/services rather than documenting the work done.
- Frequent collaboration with key stakeholders rather than status updates once every few weeks.
- The Constant change of the tasks rather than scope freeze.
- Prefer communication with the stakeholders over rigid procedures.

Risk Rating Matrix
Read in detail comparison of all the project management methodologies.
KPI (Key Performance Indicator) for Agile Projects
- A budget used (%) vs. sprint completion (%): This KPI measures the percent of the budget that was utilized to complete the sprint versus the percent of the sprint (or the work) that was completed. The desired outcome is that the sprint completion percentage is higher than the budget spent percentage.
- Overall remaining days vs. planned days to date: Each sprint is assigned a due date, and from this date, the duration for each sprint is calculated. This KPI measures the overall days left to complete the sprint versus the overall estimated days the team thinks they need to complete the sprint. The desired outcome is that the estimated duration is less than or equal to the remaining days.
- Bugs to fix vs. resolved bugs: This KPI on its own doesn’t give a full picture of the status, but paired with KPI #2, it has value. It measures the overall known bugs that need to be fixed versus the ones that were fixed. Ideally, the number of bugs that have yet to be resolved will diminish over time, and only a handful will be left a few days before the sprint due date.
- Overall Earned Value (EV): The most important KPI measures how much was earned vs. how much was spent. This is basically the bottom line. The desired outcome, of course, is that the cumulative earned will be higher than the cumulative spent budget.
- Risk Matrix: This KPI measures the severity of the risk by multiplying the risk's impact should it come to fruition by the likelihood that it will occur. The Impact and Likelihood are estimated by the team and management and are marked between 1 (low impact and highly unlikely) to 5 (major impact and very likely). A result is a number between 1 and 25. The higher the number, the more attention, and mitigation it requires. The desired outcome is to move the risks from the higher number to the lower ones as the project progresses and materializes.


