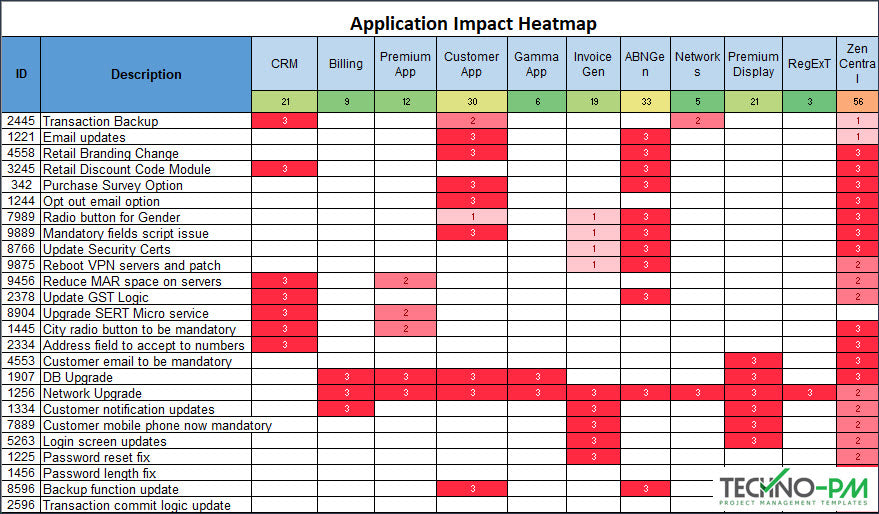
Application Impact Excel Heatmap Chart
Introduction
The application heatmap excel template is designed to identify the applications at risk with a given release. The heatmap gives all the stakeholders a clear picture of the changes and applications affected by this release.

Advantages Of Heatmap
- It provides a high-level view of all the changes and their impact on applications.
- Highlights individual applications with traffic light color coding from green to red.
- The heatmap can be displayed as a dashboard to stakeholders and explain the risks involved.
- It can be used by operational teams in troubleshooting issues.
How To Use The Heatmap?
- The changes with their IDs are listed on the left-hand side of the heatmap, and the applications are on the top.
- The application heatmap allows a user to give 3 different grades for impact – Low, Medium, and High Impact.
- Low impact is when the change does not have a considerable impact on the application. It practically does not require further impact analysis.
- The medium-impact is when the change affects the application and could cause issues when the changes go live. A further impact analysis is recommended for such changes.
- High impact is when the change actually alters the fundamental architecture or design of the application. This could mean that extensive analysis should be done for the difference. Additional approvals should be sought from stakeholders before this change goes live.
You may also be interested in Project Heatmap Excel Template


