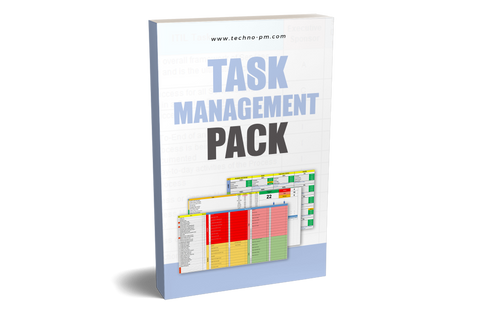
Excel Task Tracker Dashboard Template
Task Tracker
This excel task management dashboard and tracker can be used to manage a set of tasks. The dashboard graphs show 3 key areas of tracking - Task Information, Status, and Resource Load.

Excel Task Management Dashboard
Advantages And Features Of Excel Task Management Dashboard
- Track status based on % complete.
- Highlights overdue and complete tasks for better visualization of problem tasks.
- Can handle a list of 20 pre-defined holidays. Holidays are reduced from the duration.
- Calculates % Complete Forecast based on start and finish dates.
- Progress is reported using traffic light indicators.
- The end date is auto-calculated based on the start date and duration of the tasks.
- Provides a high-level graphical view of information, status, and resource load.
- Task Information Graphs show the following breakup - Total, Not Started, In-Progress, Complete and Overdue.
- Task Status shows the breakup for the On track, Concern, and Delayed.
- Resource Load refers to visualizing the allocation of team members' time and tasks over a period. It displays the distribution of workload across individuals, allowing for efficient resource management and scheduling.
Some Key Points About Statues
- Progress is reported based on the difference between Actual % Complete and Forecast % Complete.
- A task is highlighted as green in the progress column if it is on track. So, the % complete should be equal to or greater than the forecast % complete.
- Highlighted as amber when progress is less than 5% behind schedule. So, the delay should be between 1 - 5%.
- Highlighted as red when the task is delayed by more than 5% complete.
- Highlighted as overdue when the end date has passed, and it is not complete.
- Highlighted as complete if the actual % complete is 100%.
How To Use The Dashboard Template
How to use the task tracker and dashboard
Step 1: In the sheet's data tab, define the resource names and public holidays in your region.
Step 2: Create the task by copying an existing row. You must copy the existing row so that the formulas get copied.
Step 3: Add the basic details like Sl. No, Task, Resource Name/Assigned (dropdown), and Project Name.
Step 4 (Key Step): Enter ONLY the start date and the duration.
End date, Forecast Complete %, Progress, Overdue and complete column will be auto-populated. DON'T CHANGE THE VALUES IN THE COLUMNS WITH BLUE HEADINGS.
Once the basic steps are complete, steps 2,3, and 4 will have to be repeated regularly. It is recommended that you update Actual % Complete regularly so that the charts will give the latest status. Please see the below image for different types of charts in the dashboard.
Task Information, Task Status, and Resource Load Charts
Now Some Limitations Of This Template.
- Cannot handle individual resource holidays.
- Can handle up to 10 resource names and 20 public holidays.
- With so many columns easy to override the values in the columns with formulas.
- No data validations on any columns.
- Consider using Simple Excel Task Manager for lists of tasks and daily task manager for project managers.
- Not suitable for Team Task Prioritization and Monthly Team Task Planning.


